2024 Demographics
This webpage provides demographic elements on population, housing, economic, education, transportation and occupation characteristics for Lancaster County. Click the drop down menu to view data by county, zip code or region.
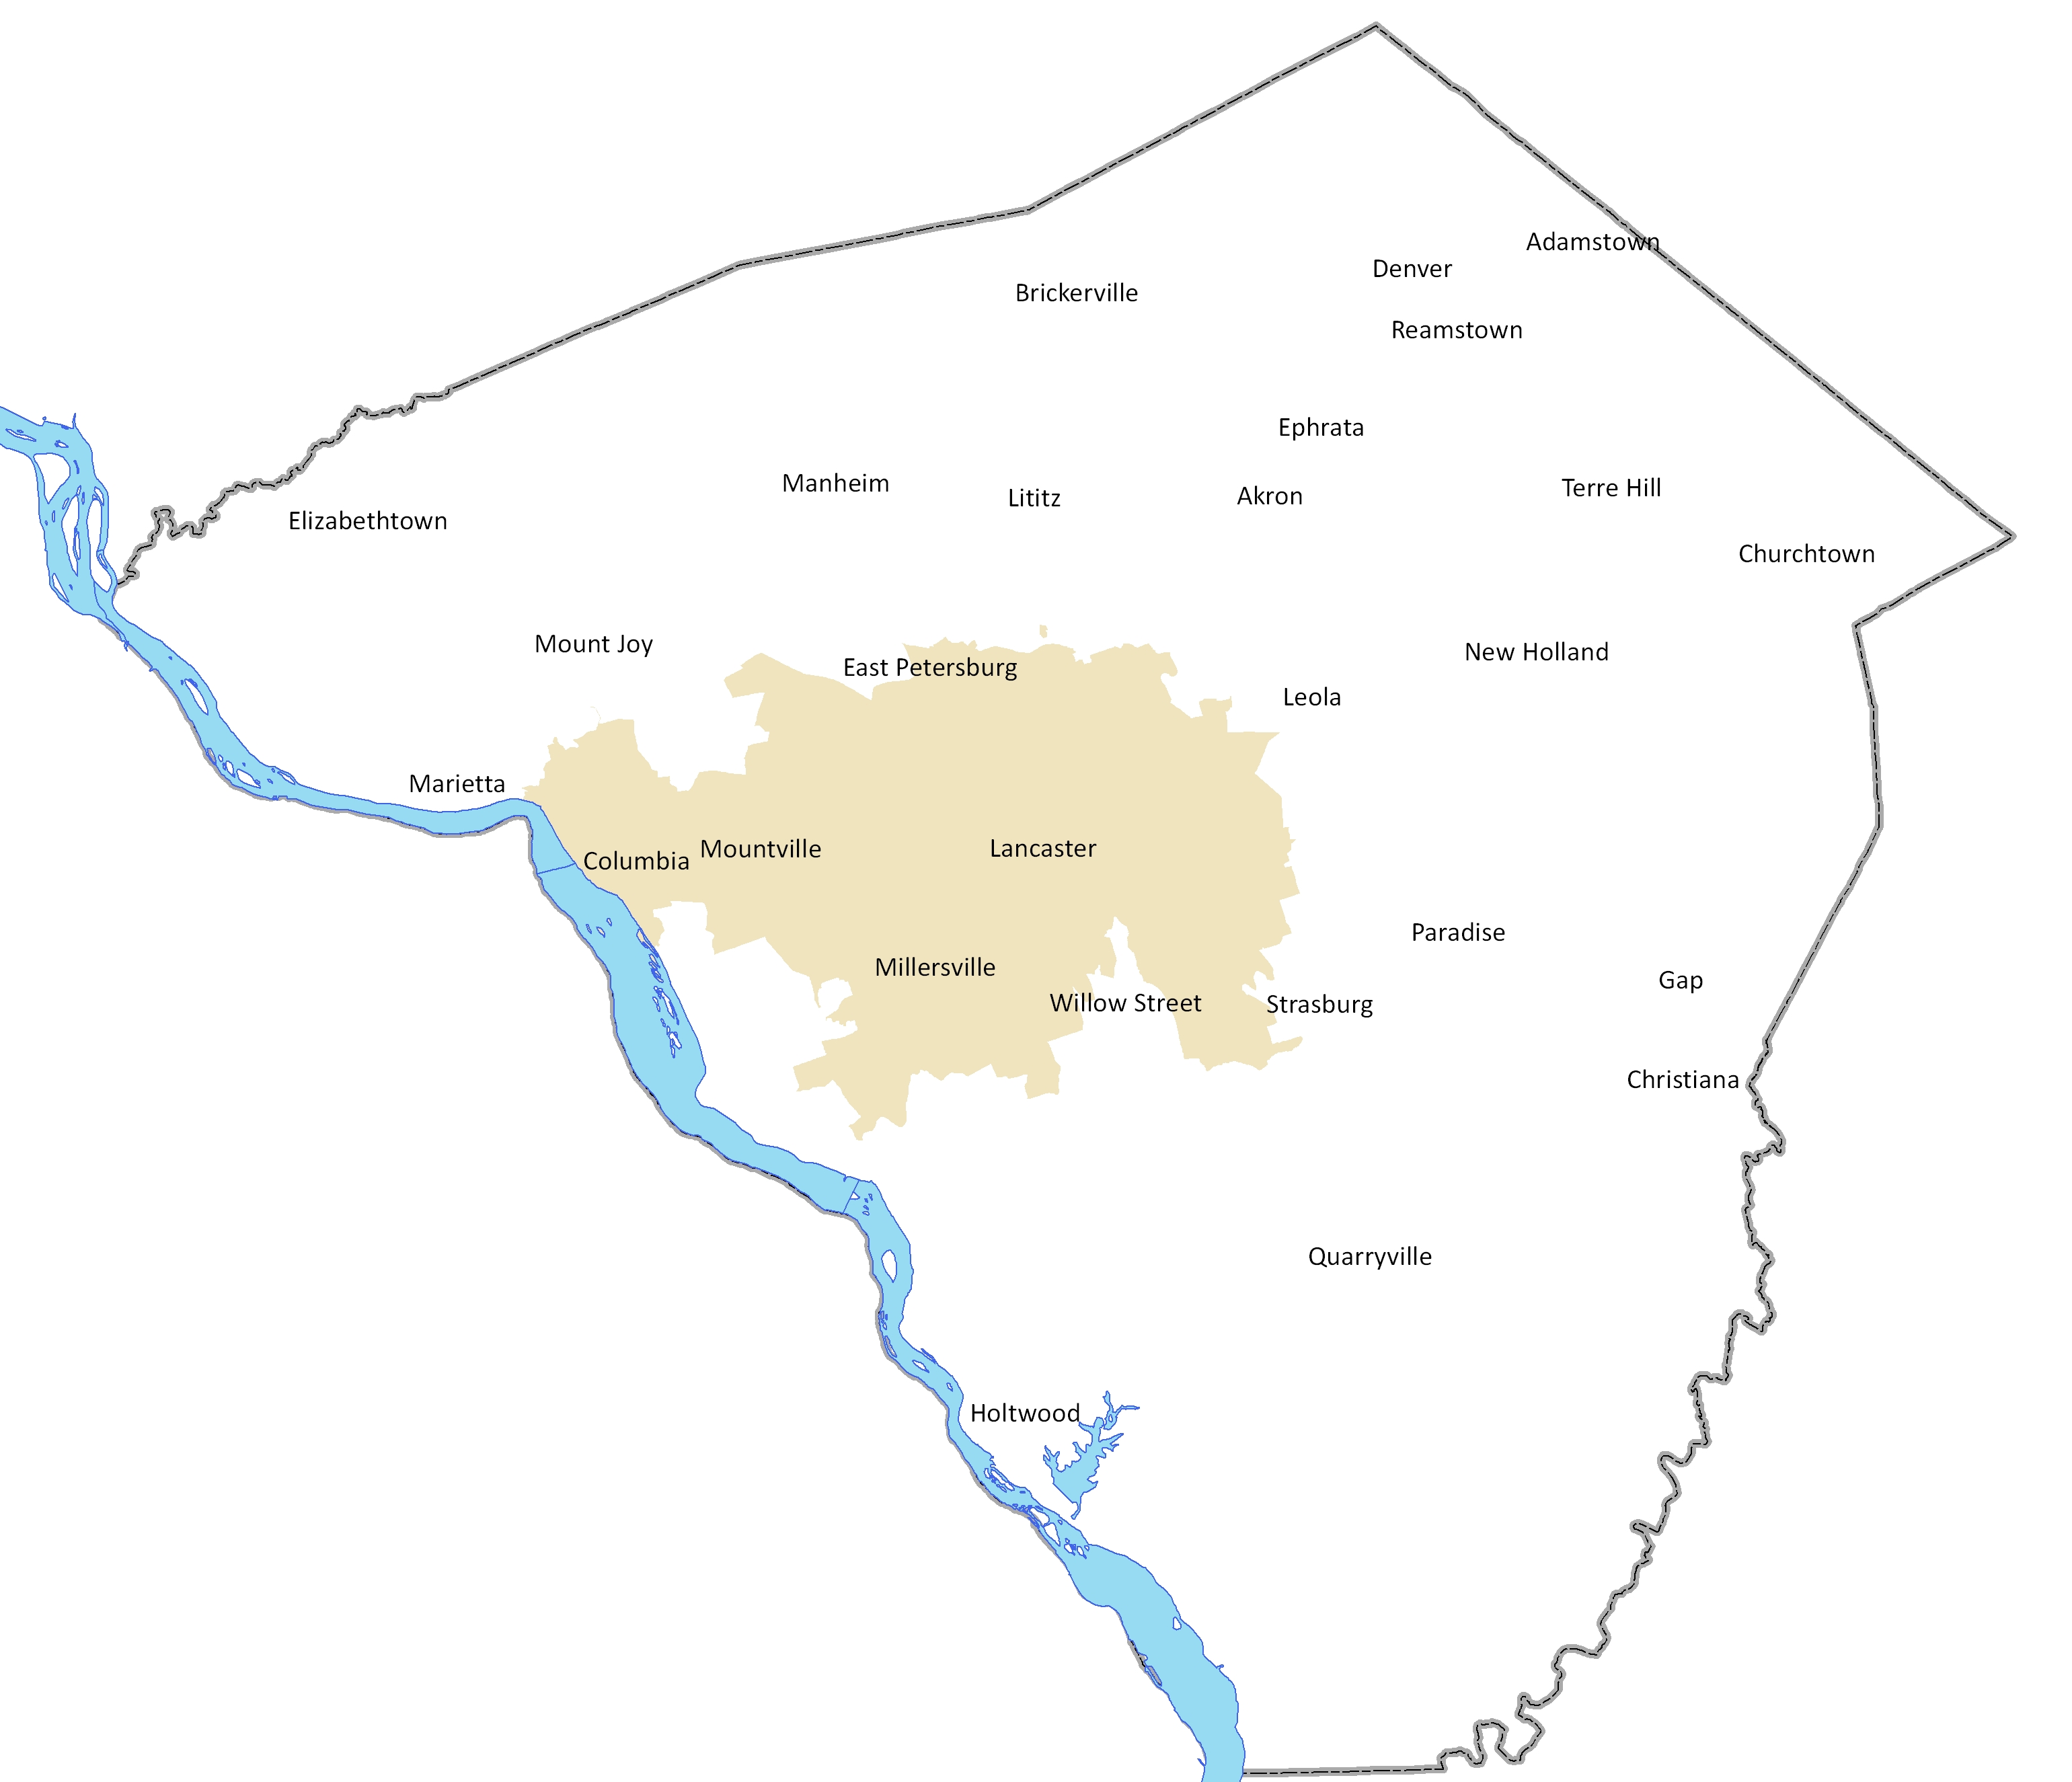
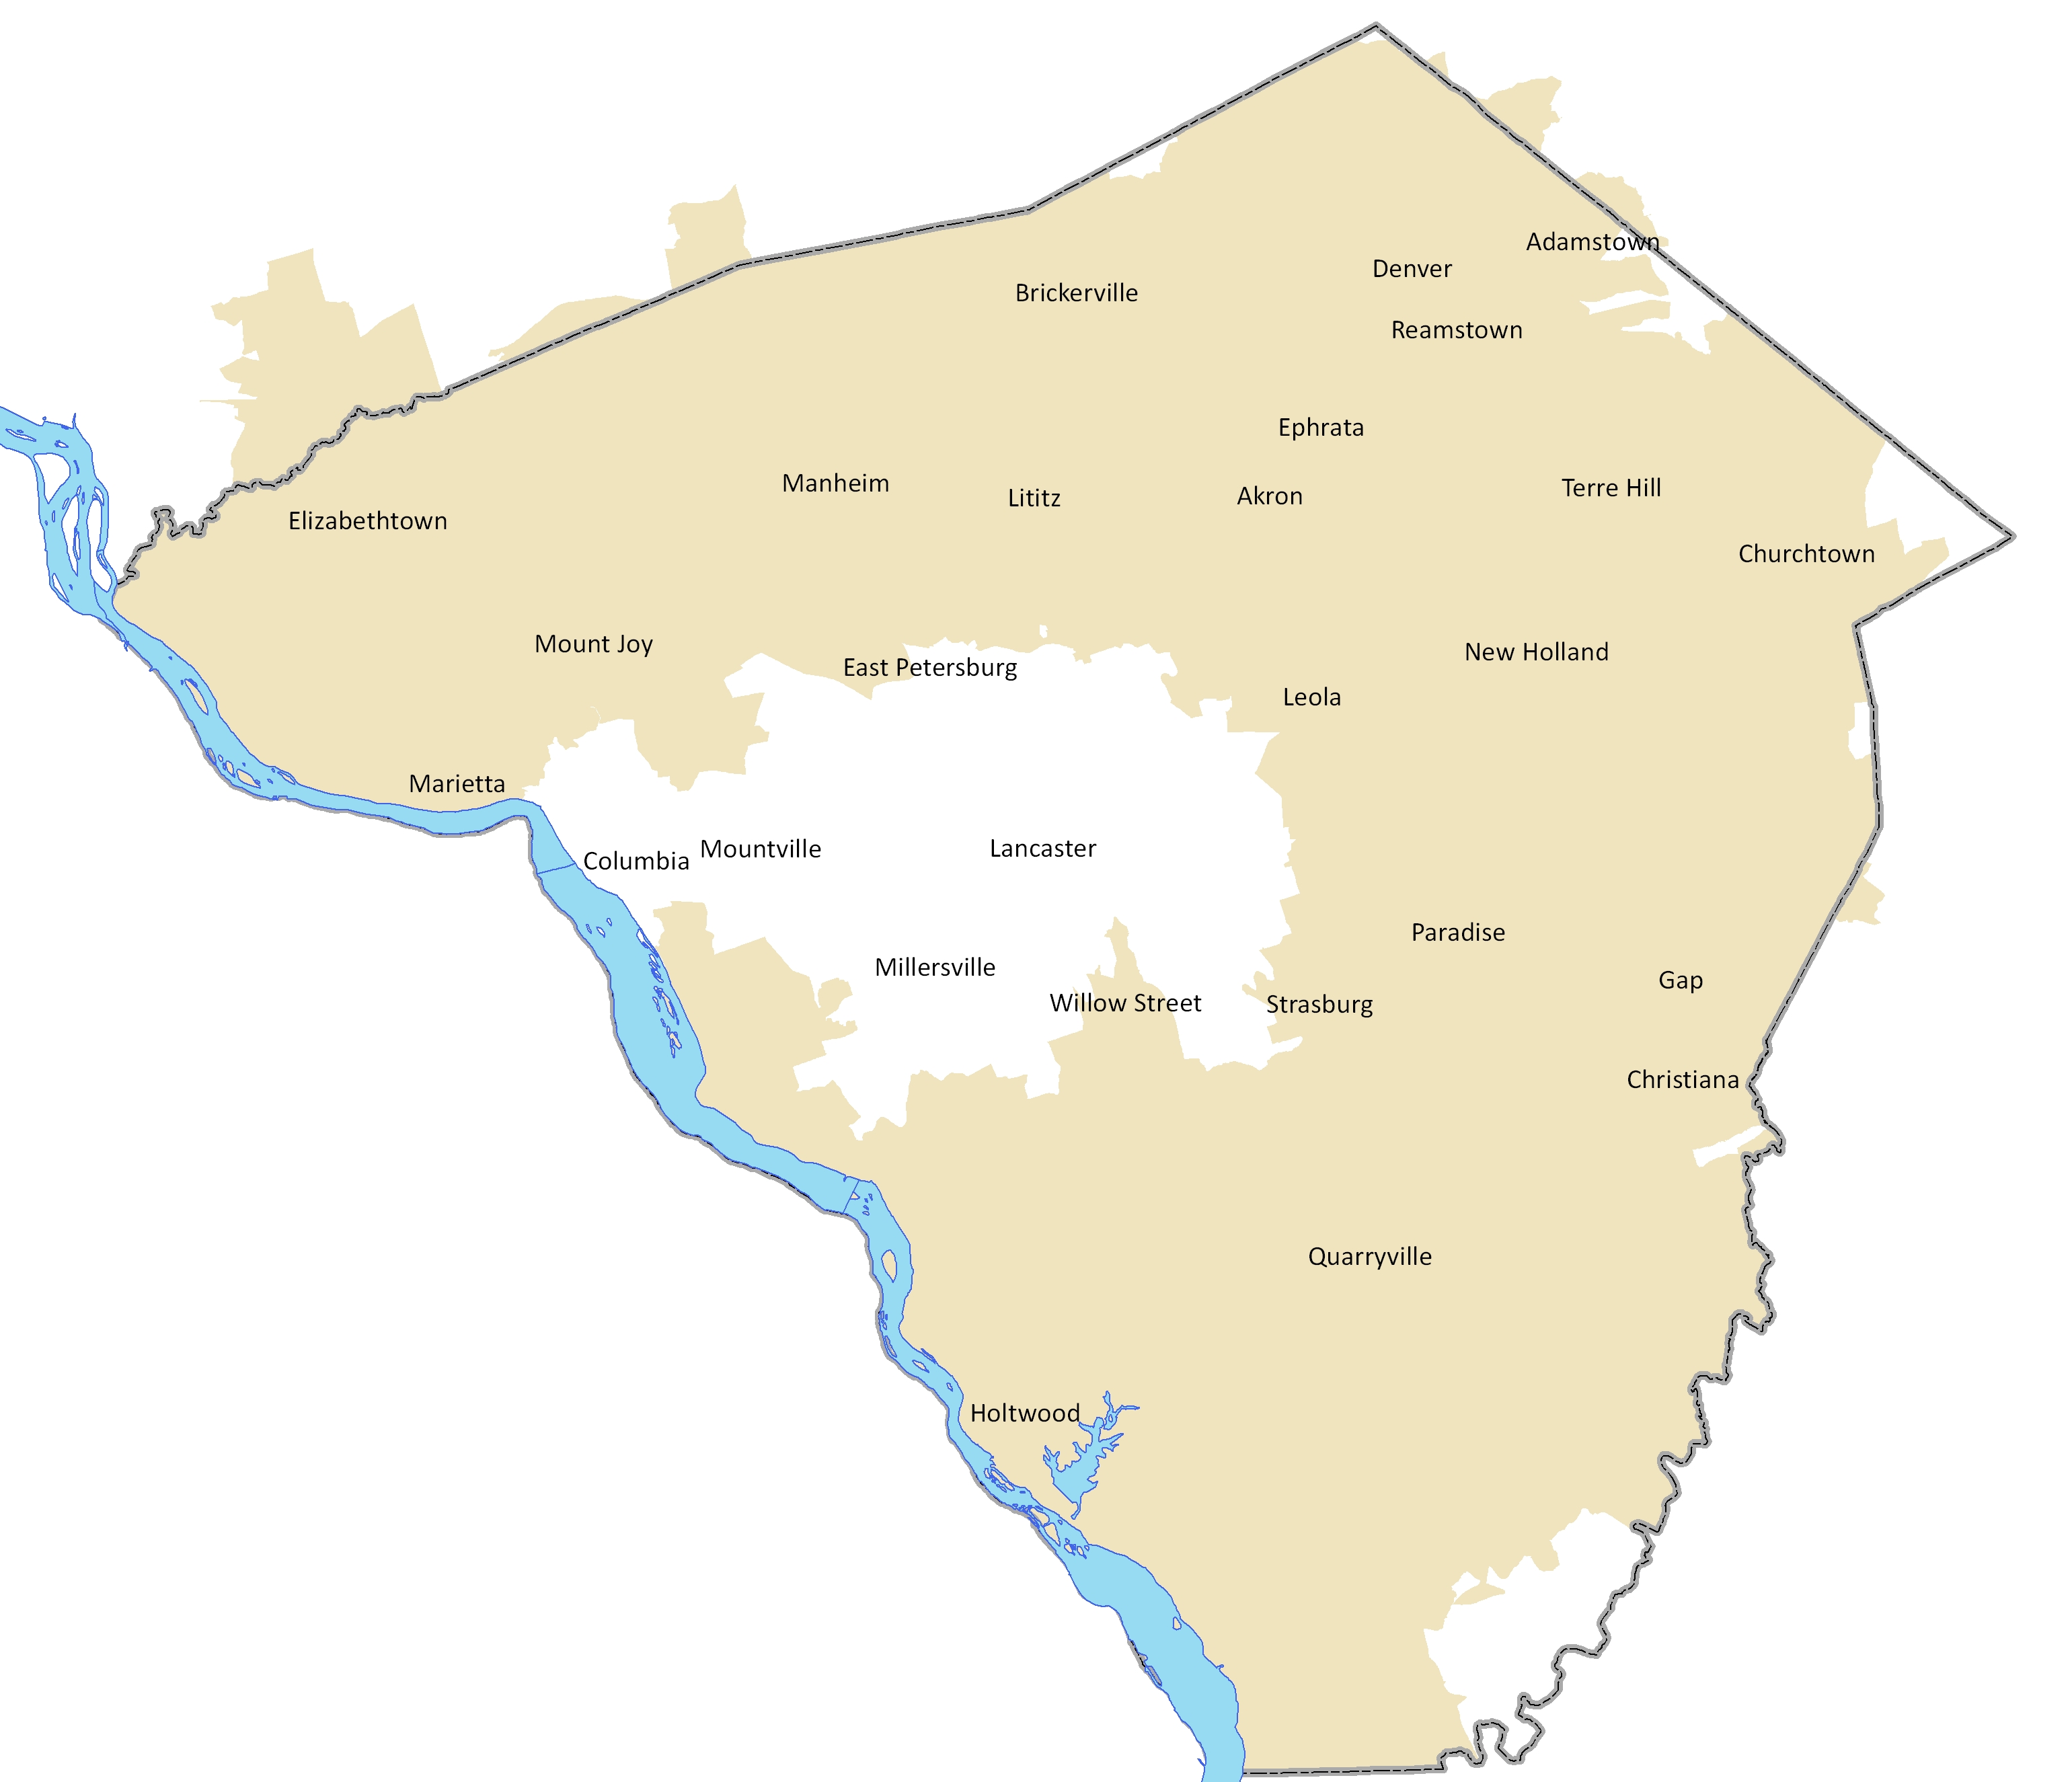
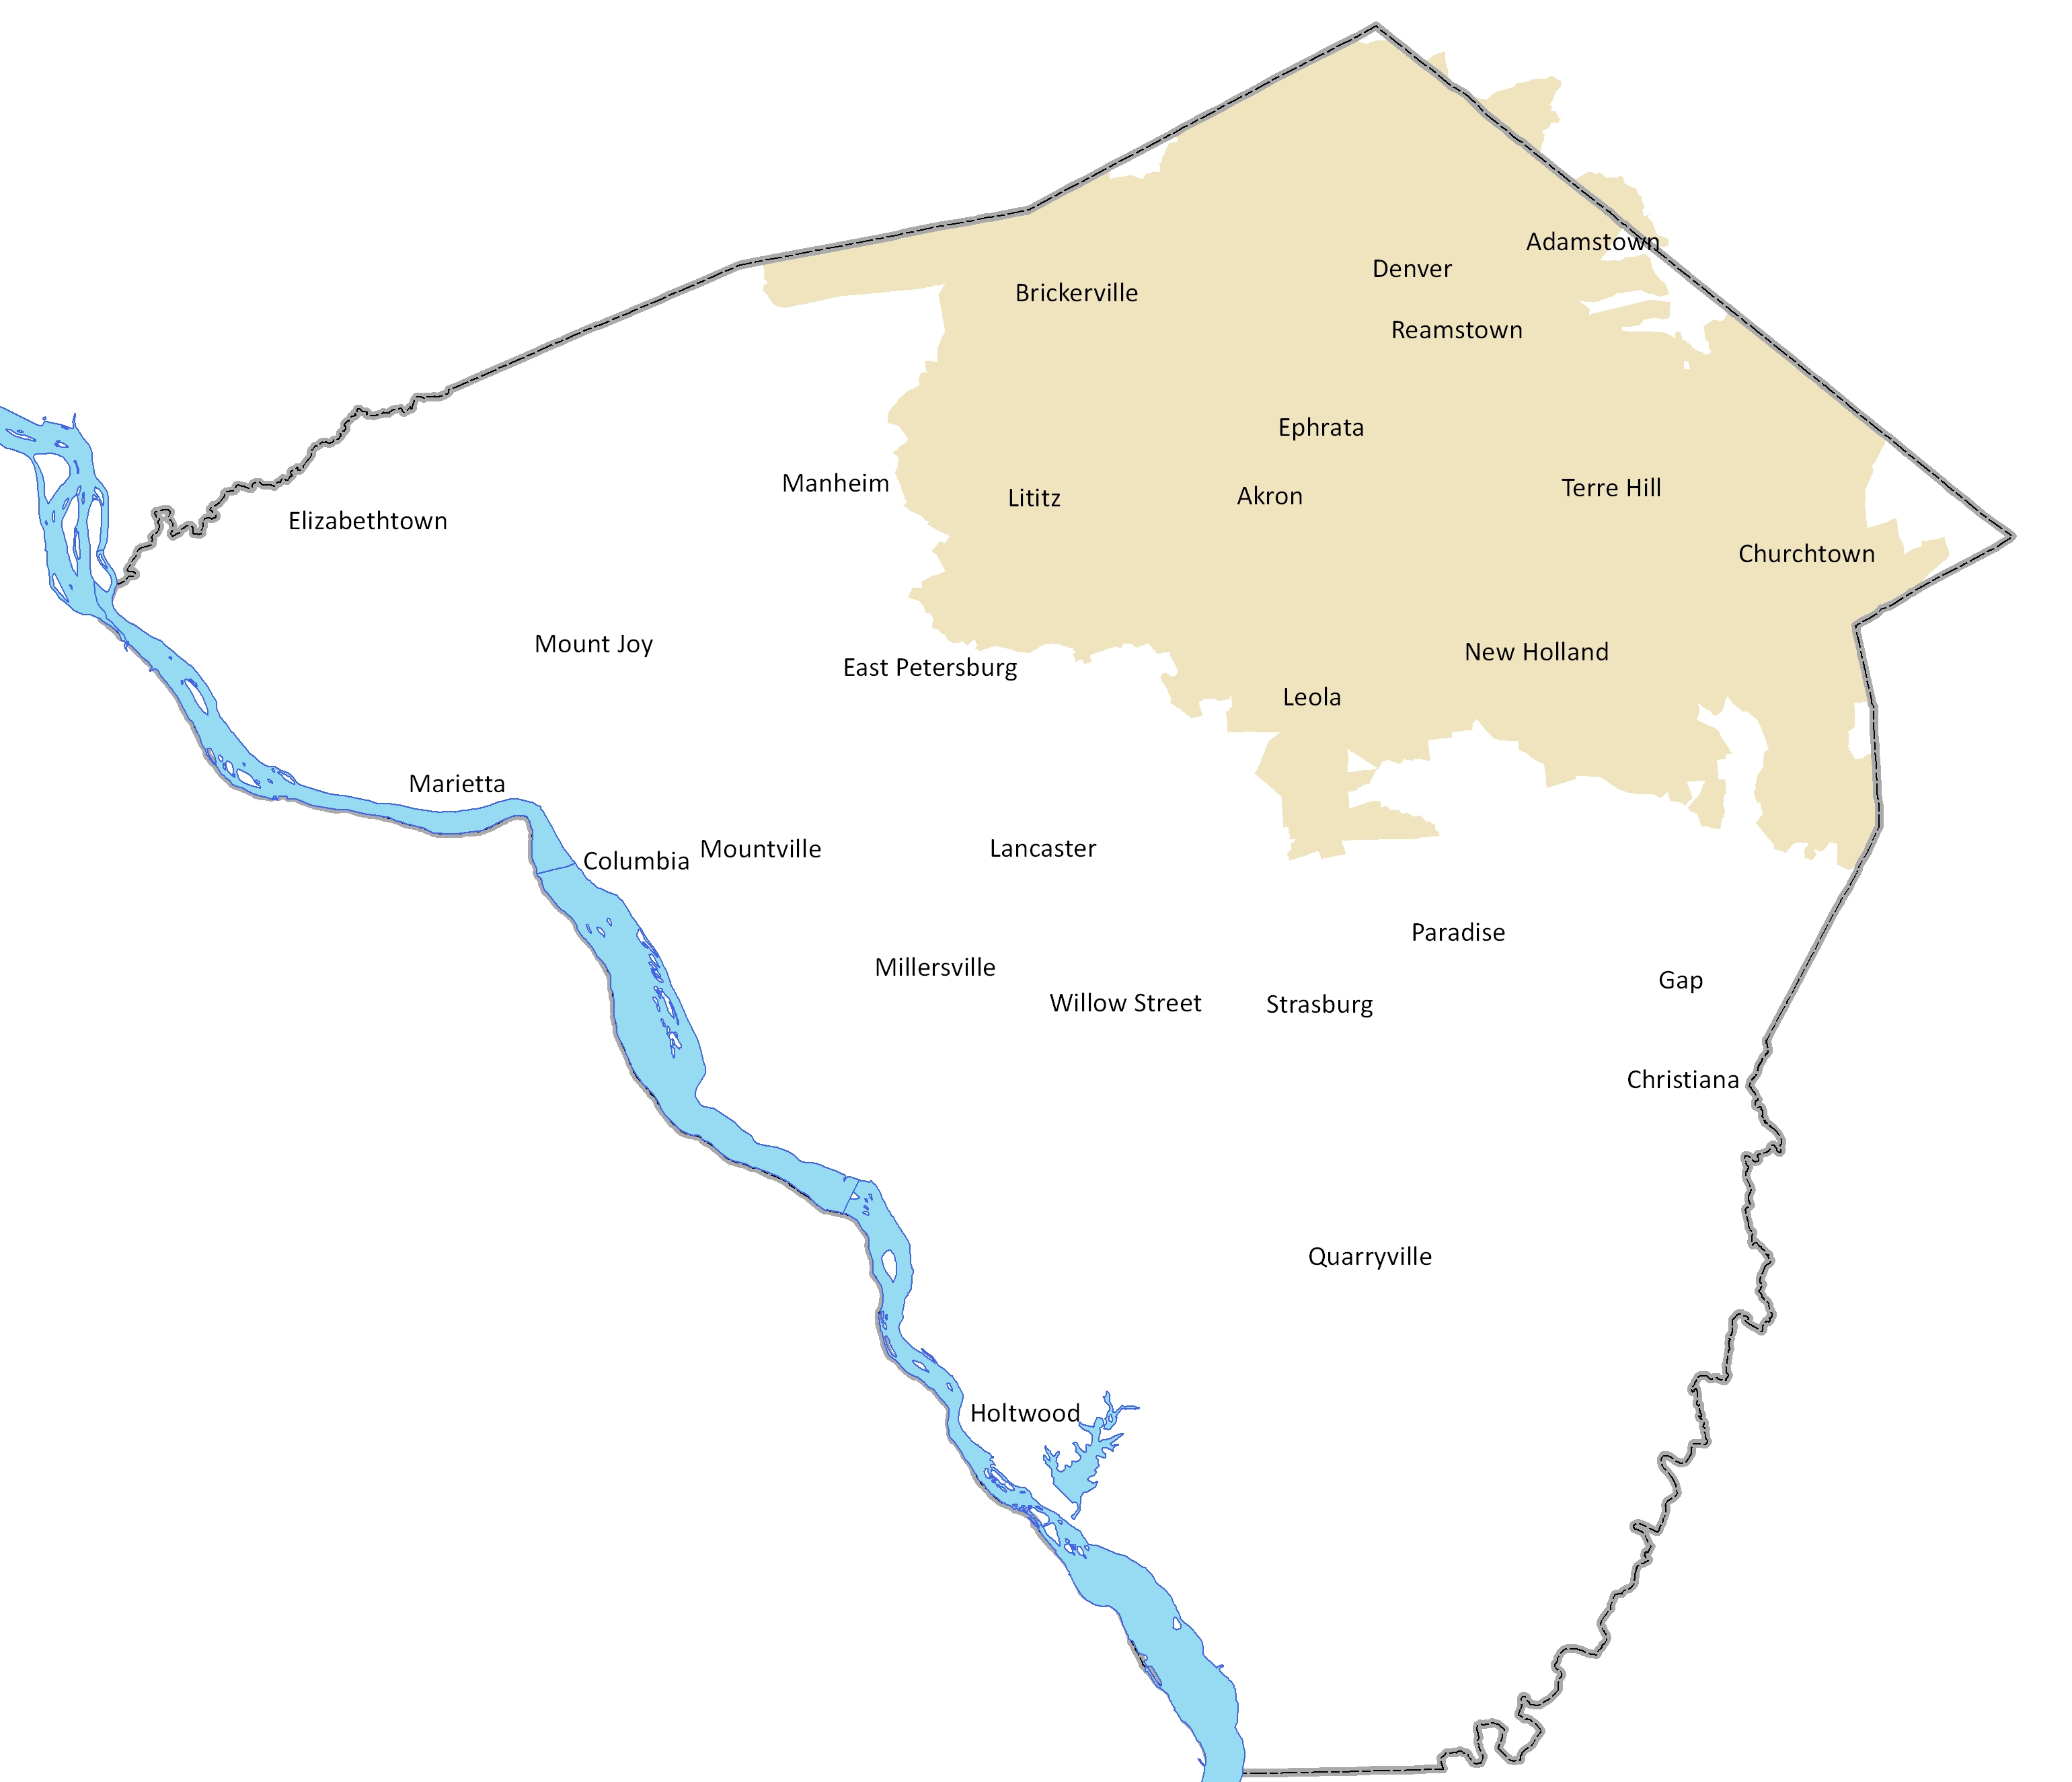
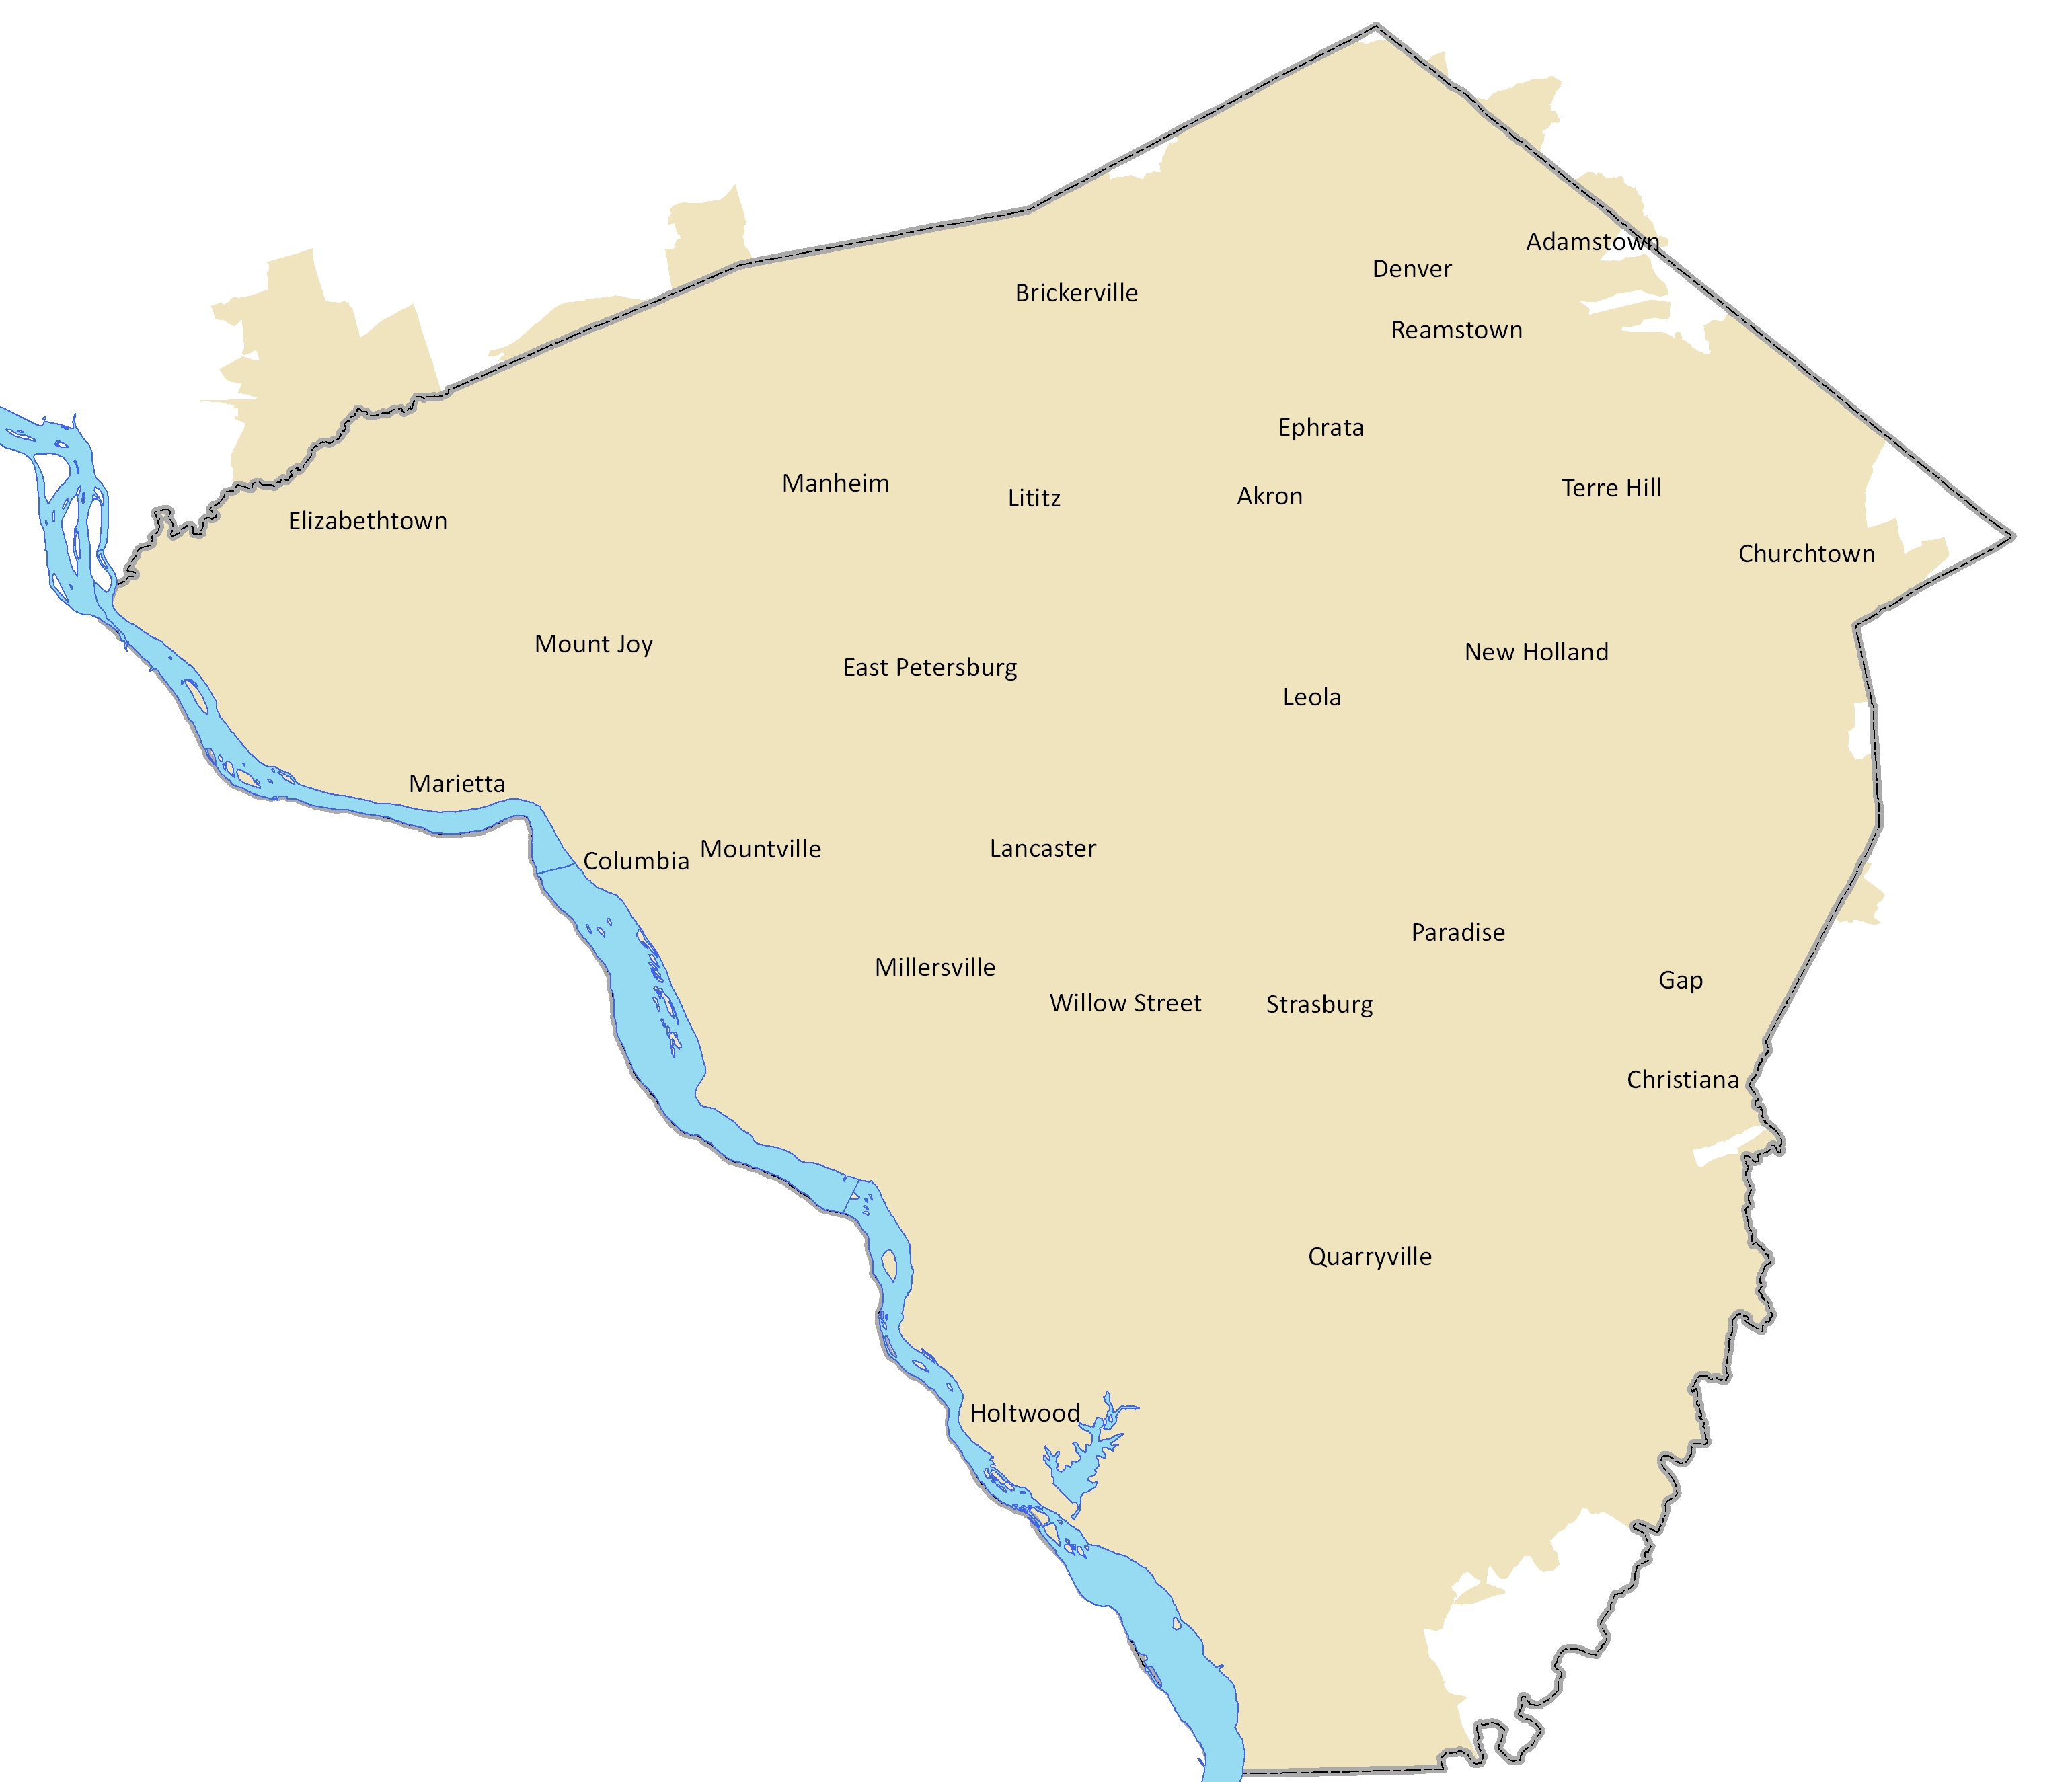
The maps below show the zip areas associated with the urban, rural and northeast regions in Lancaster County. Some zip codes in Lancaster County may not be associated with population or demographics data (e.g., PO Box zip codes). If you do not find your zip code in the drop down menu, look at the data for the zip area in which you reside.
| Urban Zip Areas | Rural Zip Areas | Northeast Zip Areas | All Zip Areas |
 |
 |
 |
 |
Employment Data for State: Pennsylvania
Jump to:
Population 16+: Unemployed
State: Pennsylvania
5.80%
| Workers by Means of Transportation to Work | State: Pennsylvania | |
|---|---|---|
| Workers | % of Workers | |
| Worked at Home | 893,600 | 14.22% |
| Walked | 197,608 | 3.15% |
| Bicycle | 25,520 | 0.41% |
| Carpooled | 471,045 | 7.50% |
| Drove Alone | 4,381,754 | 69.74% |
| Public Transport | 234,901 | 3.74% |
| Other | 78,243 | 1.25% |
| Workers by Travel Time to Work | State: Pennsylvania | |
|---|---|---|
| Workers | % of Workers | |
| Under 15 Minutes | 1,513,439 | 26.71% |
| 15 - 29 Minutes | 2,054,879 | 36.26% |
| 30 - 44 Minutes | 1,157,234 | 20.42% |
| 45 - 59 Minutes | 477,260 | 8.42% |
| 60+ Minutes | 463,722 | 8.18% |
Average Commute Time
State: Pennsylvania
29
Minutes
| Employed Civilian 16+ by Industry | State: Pennsylvania | |
|---|---|---|
| Persons | % of Employed Civilian 16+ Population | |
| Accommodation/Food Services | 368,419 | 5.75% |
| Admin/Spprt/Waste Mgmt | 227,776 | 3.56% |
| Agriculture/Forest/Fish/Hunt | 77,813 | 1.21% |
| Entertainment/Rec Svcs | 109,230 | 1.70% |
| Construction | 381,707 | 5.96% |
| Educational Svcs | 608,139 | 9.49% |
| Fin/Insur/RE/Rent/Lse | 421,406 | 6.58% |
| Health Care/Soc Asst | 1,075,651 | 16.79% |
| Information | 102,948 | 1.61% |
| Mgmt of Companies | 9,629 | 0.15% |
| Total Manufacturing | 752,548 | 11.75% |
| Oth Svcs, Not Pub Admin | 295,505 | 4.61% |
| Prof/Sci/Tech/Admin | 459,679 | 7.18% |
| Public Administration | 265,567 | 4.15% |
| Retail Trade | 712,859 | 11.13% |
| Transport/Warehse/Utils | 378,261 | 5.90% |
| Wholesale Trade | 159,328 | 2.49% |
| Employed Civilian 16+ by Occupation | State: Pennsylvania | |
|---|---|---|
| Persons | % of Employed Civilian 16+ Population | |
| Architect/Engineer | 131,757 | 2.06% |
| Arts/Entertain/Sports | 108,199 | 1.69% |
| Building Grounds Maint | 200,346 | 3.13% |
| Business/Financial Ops | 382,908 | 5.98% |
| Community/Soc Svcs | 136,034 | 2.12% |
| Computer/Mathematical | 216,831 | 3.38% |
| Construction/Extraction | 281,445 | 4.39% |
| Edu/Training/Library | 392,959 | 6.13% |
| Farm/Fish/Forestry | 25,620 | 0.40% |
| Food Prep/Serving | 313,104 | 4.89% |
| Health Practitioner/Tec | 479,495 | 7.48% |
| Healthcare Support | 247,920 | 3.87% |
| Maintenance Repair | 200,179 | 3.12% |
| Legal | 72,489 | 1.13% |
| Life/Phys/Soc Science | 75,230 | 1.17% |
| Management | 669,128 | 10.44% |
| Office/Admin Support | 694,234 | 10.84% |
| Production | 374,083 | 5.84% |
| Protective Svcs | 127,184 | 1.99% |
| Sales/Related | 578,701 | 9.03% |
| Personal Care/Svc | 153,290 | 2.39% |
| Transportation/Moving | 545,329 | 8.51% |
| Employed Civilian 16+ by Occupation Group | State: Pennsylvania | |
|---|---|---|
| Persons | % of Employed Civilian 16+ Population | |
| White Collar | 3,937,965 | 61.47% |
| Blue Collar | 1,401,036 | 21.87% |
| Service and Farm | 1,067,464 | 16.66% |
Demographics information provided by Claritas, updated April 2024, under these terms of use.