2024 Demographics
This webpage provides demographic elements on population, housing, economic, education, transportation and occupation characteristics for Lancaster County. Click the drop down menu to view data by county, zip code or region.
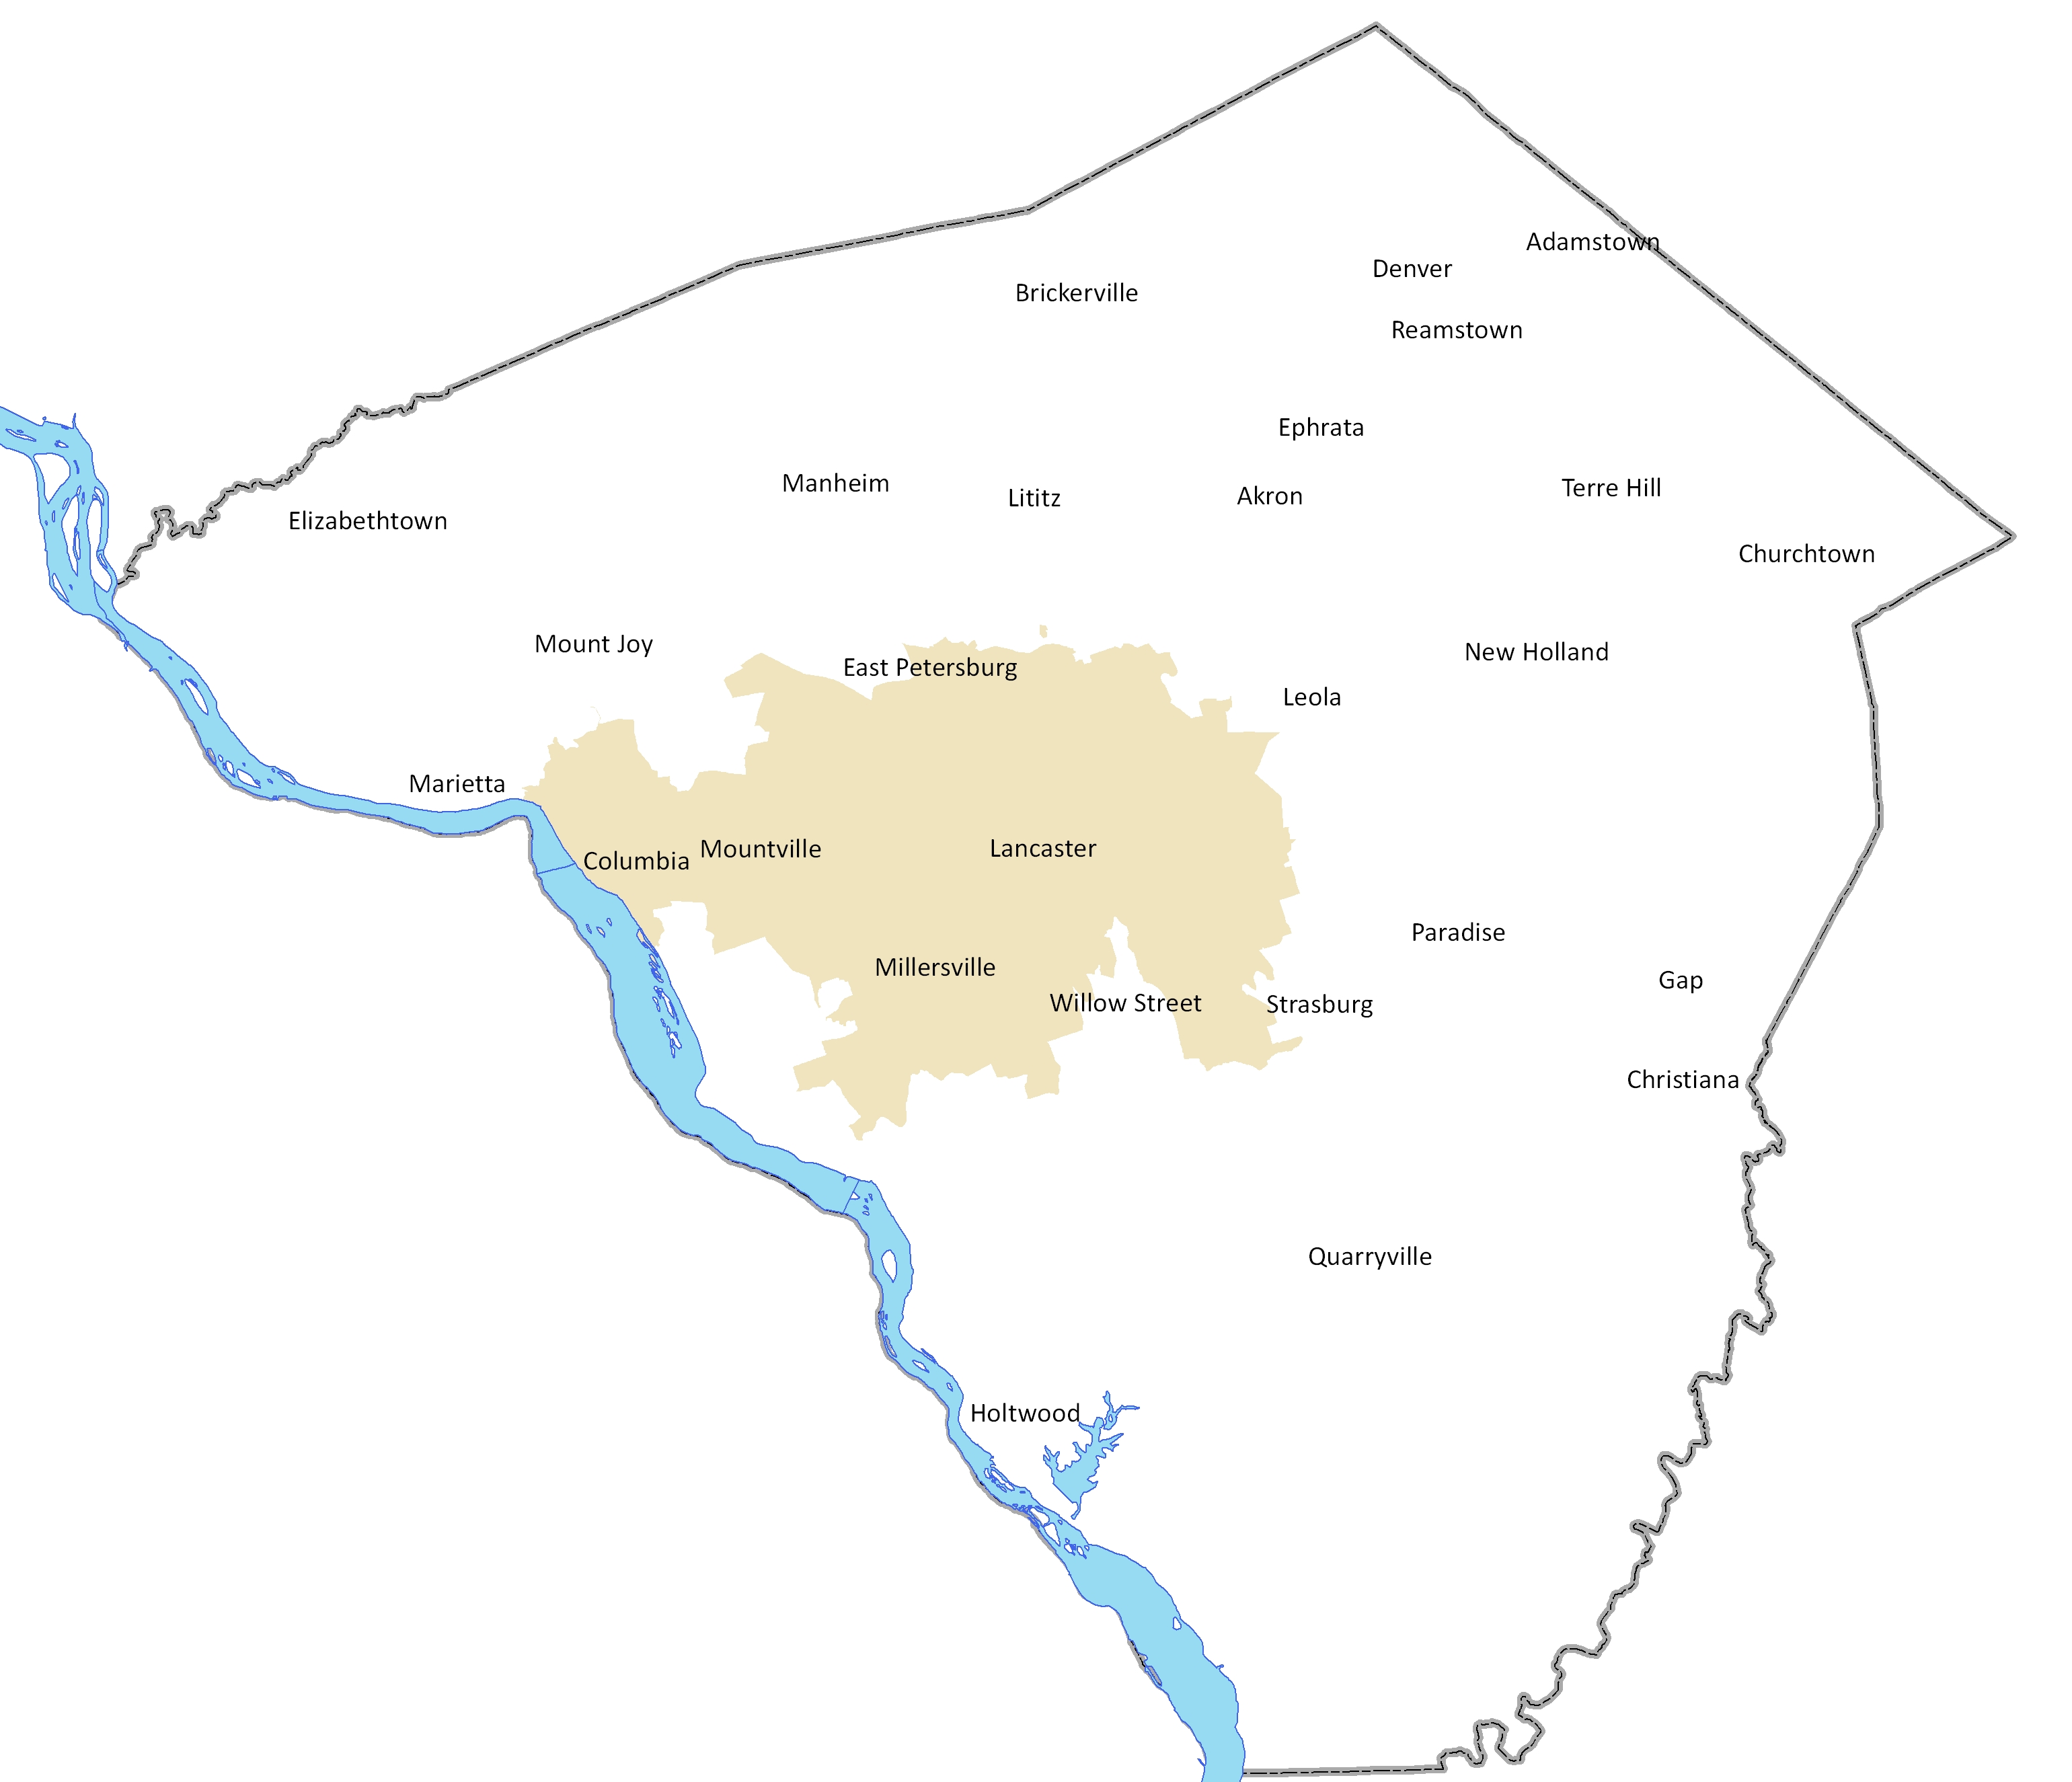
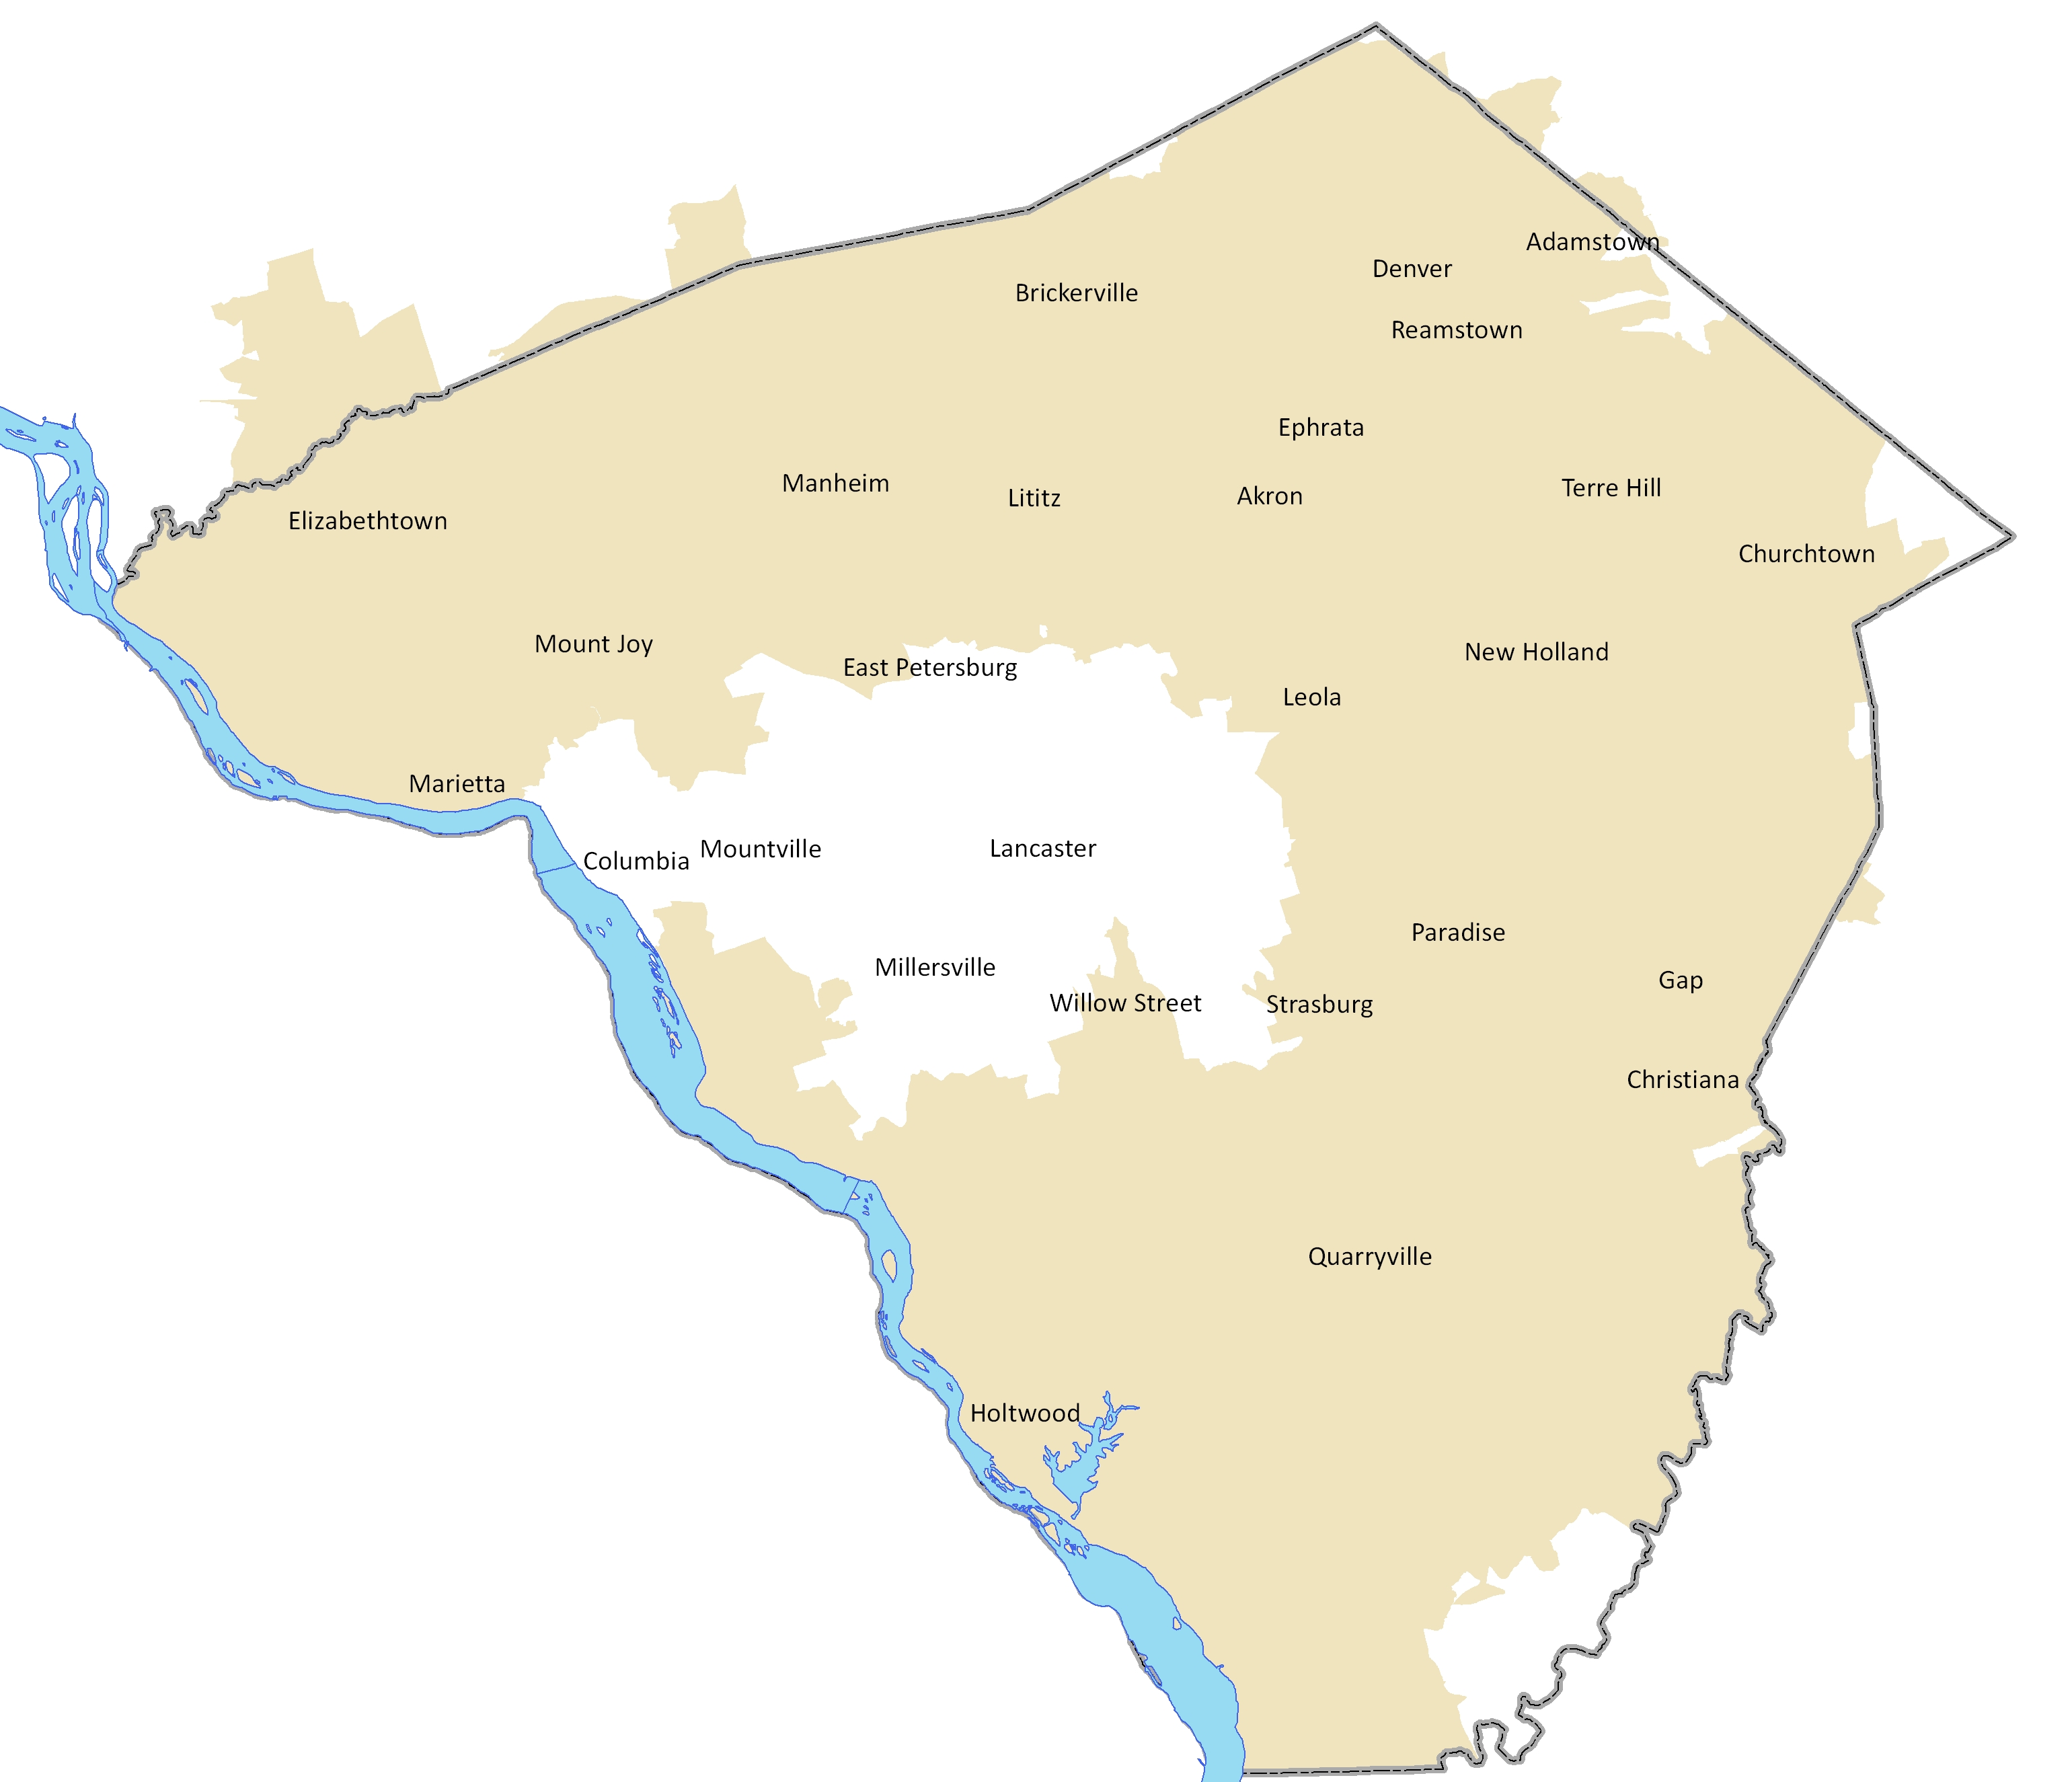
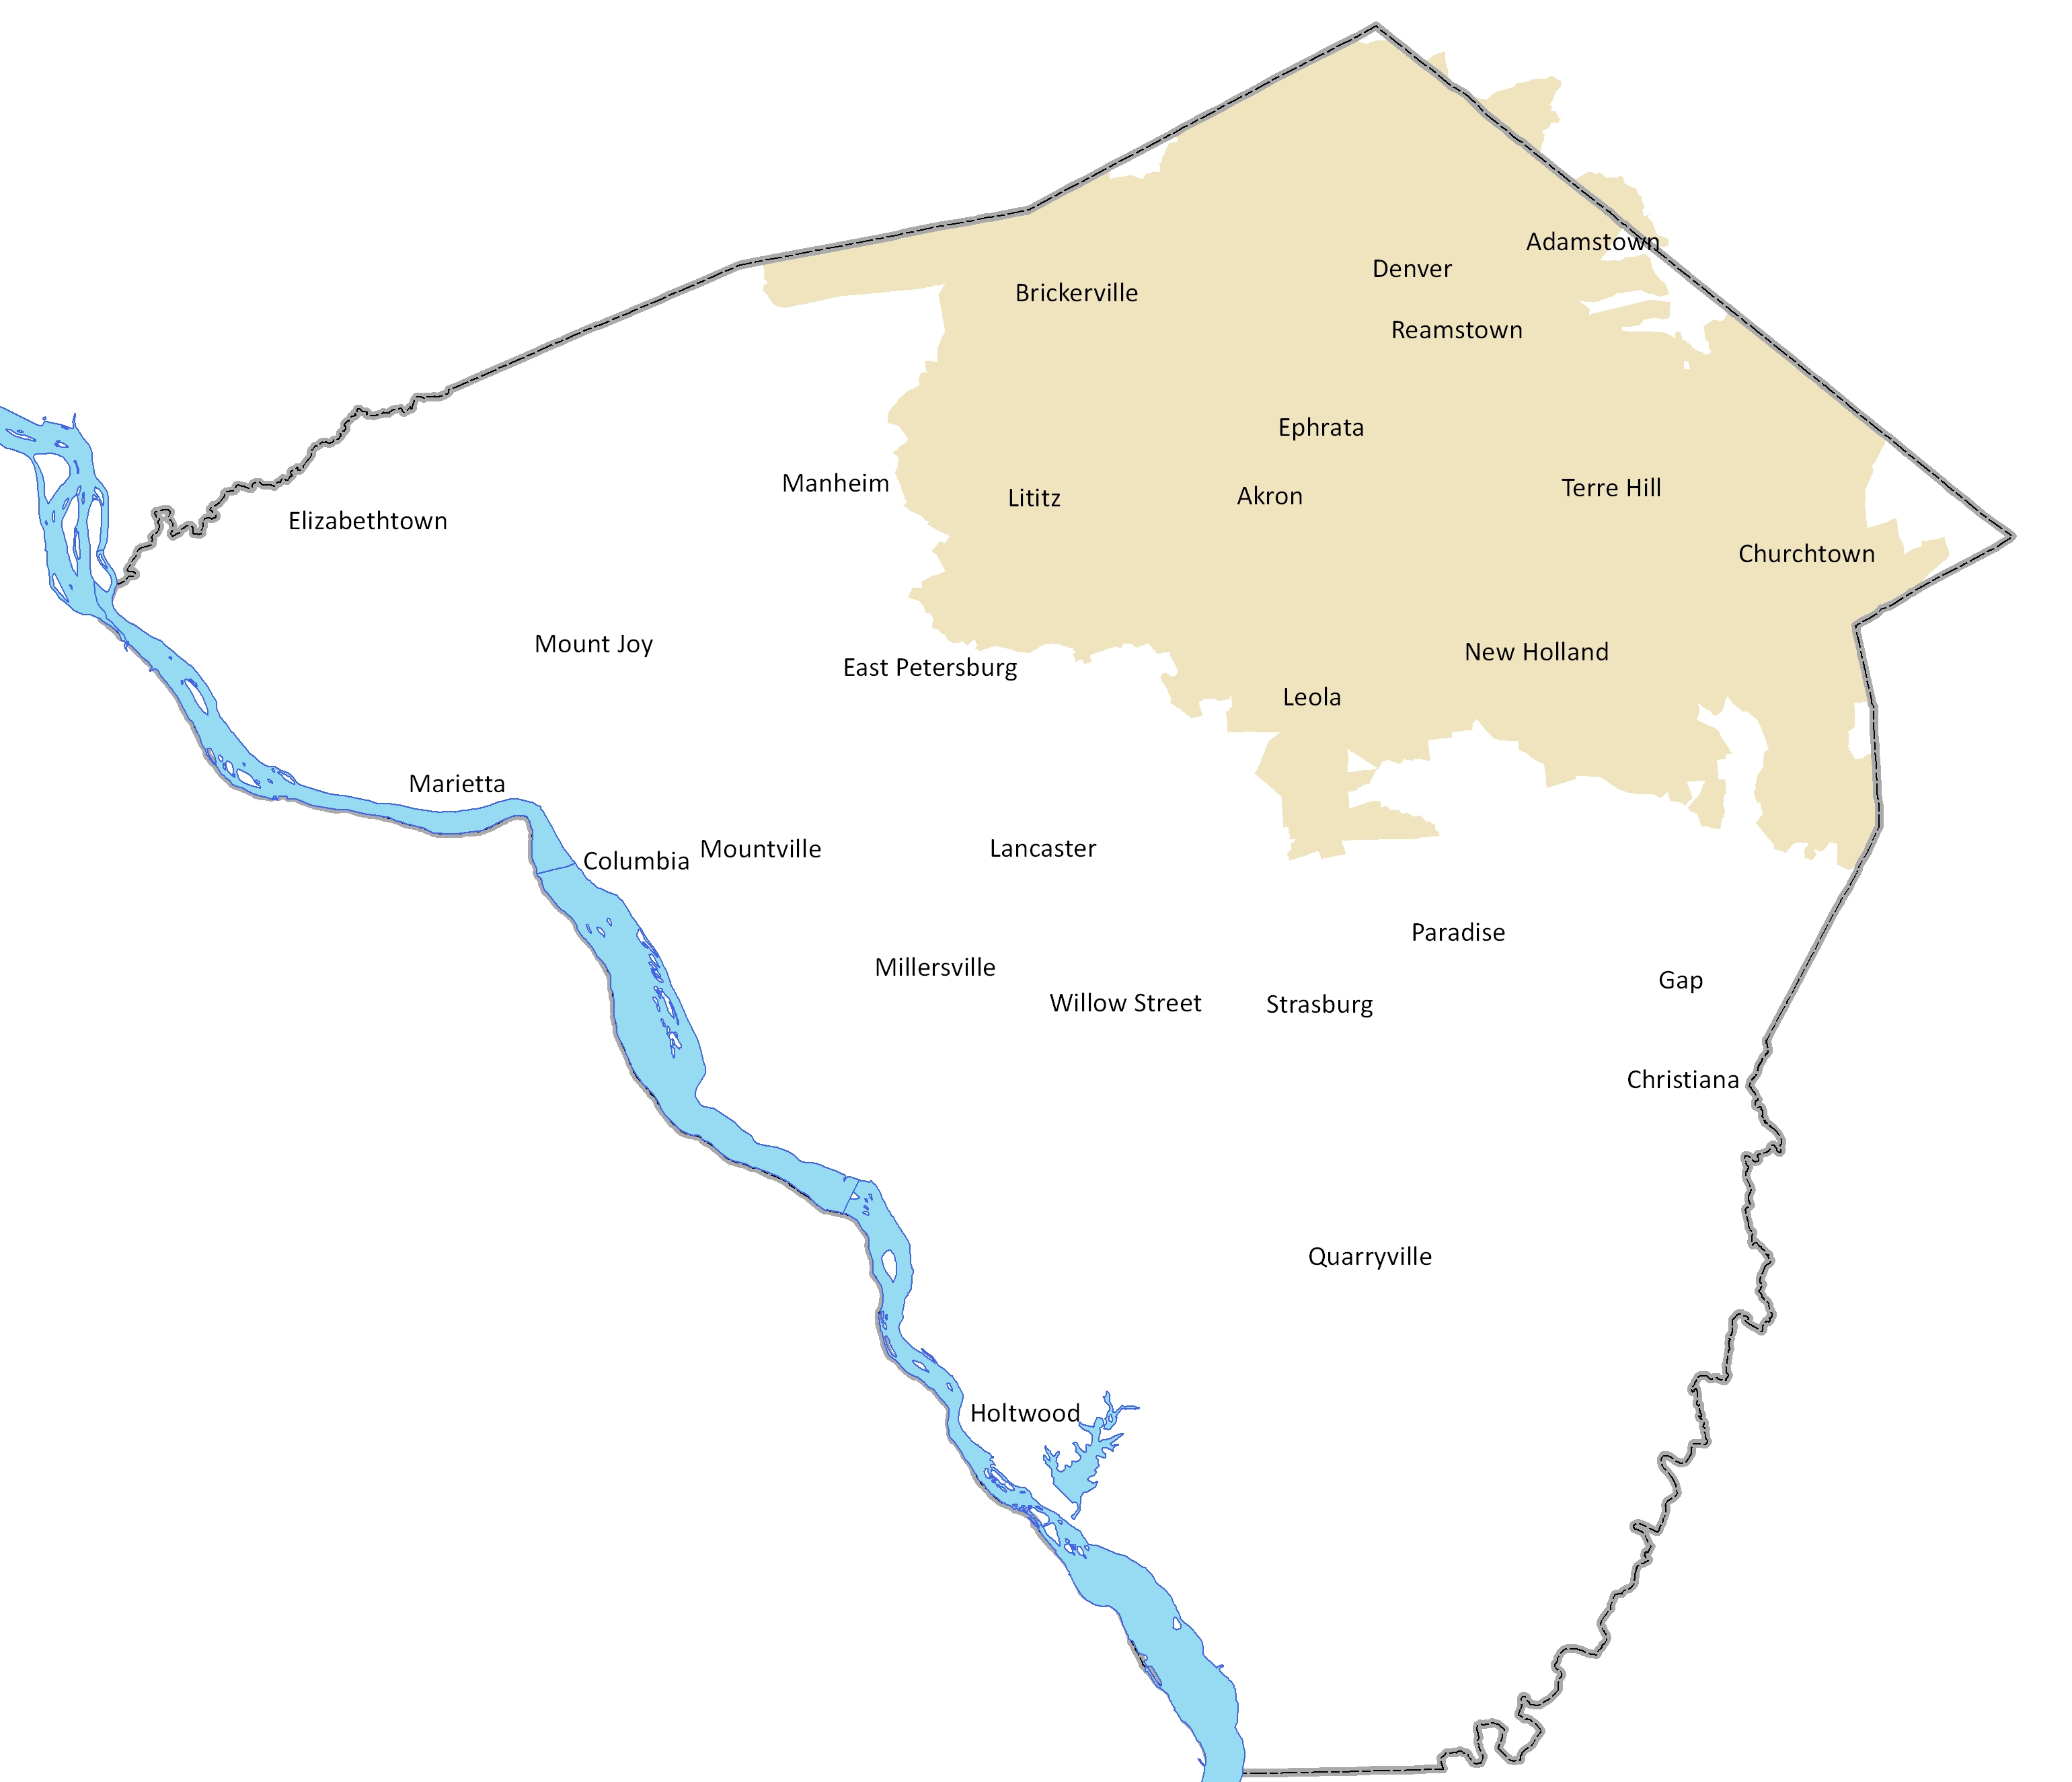
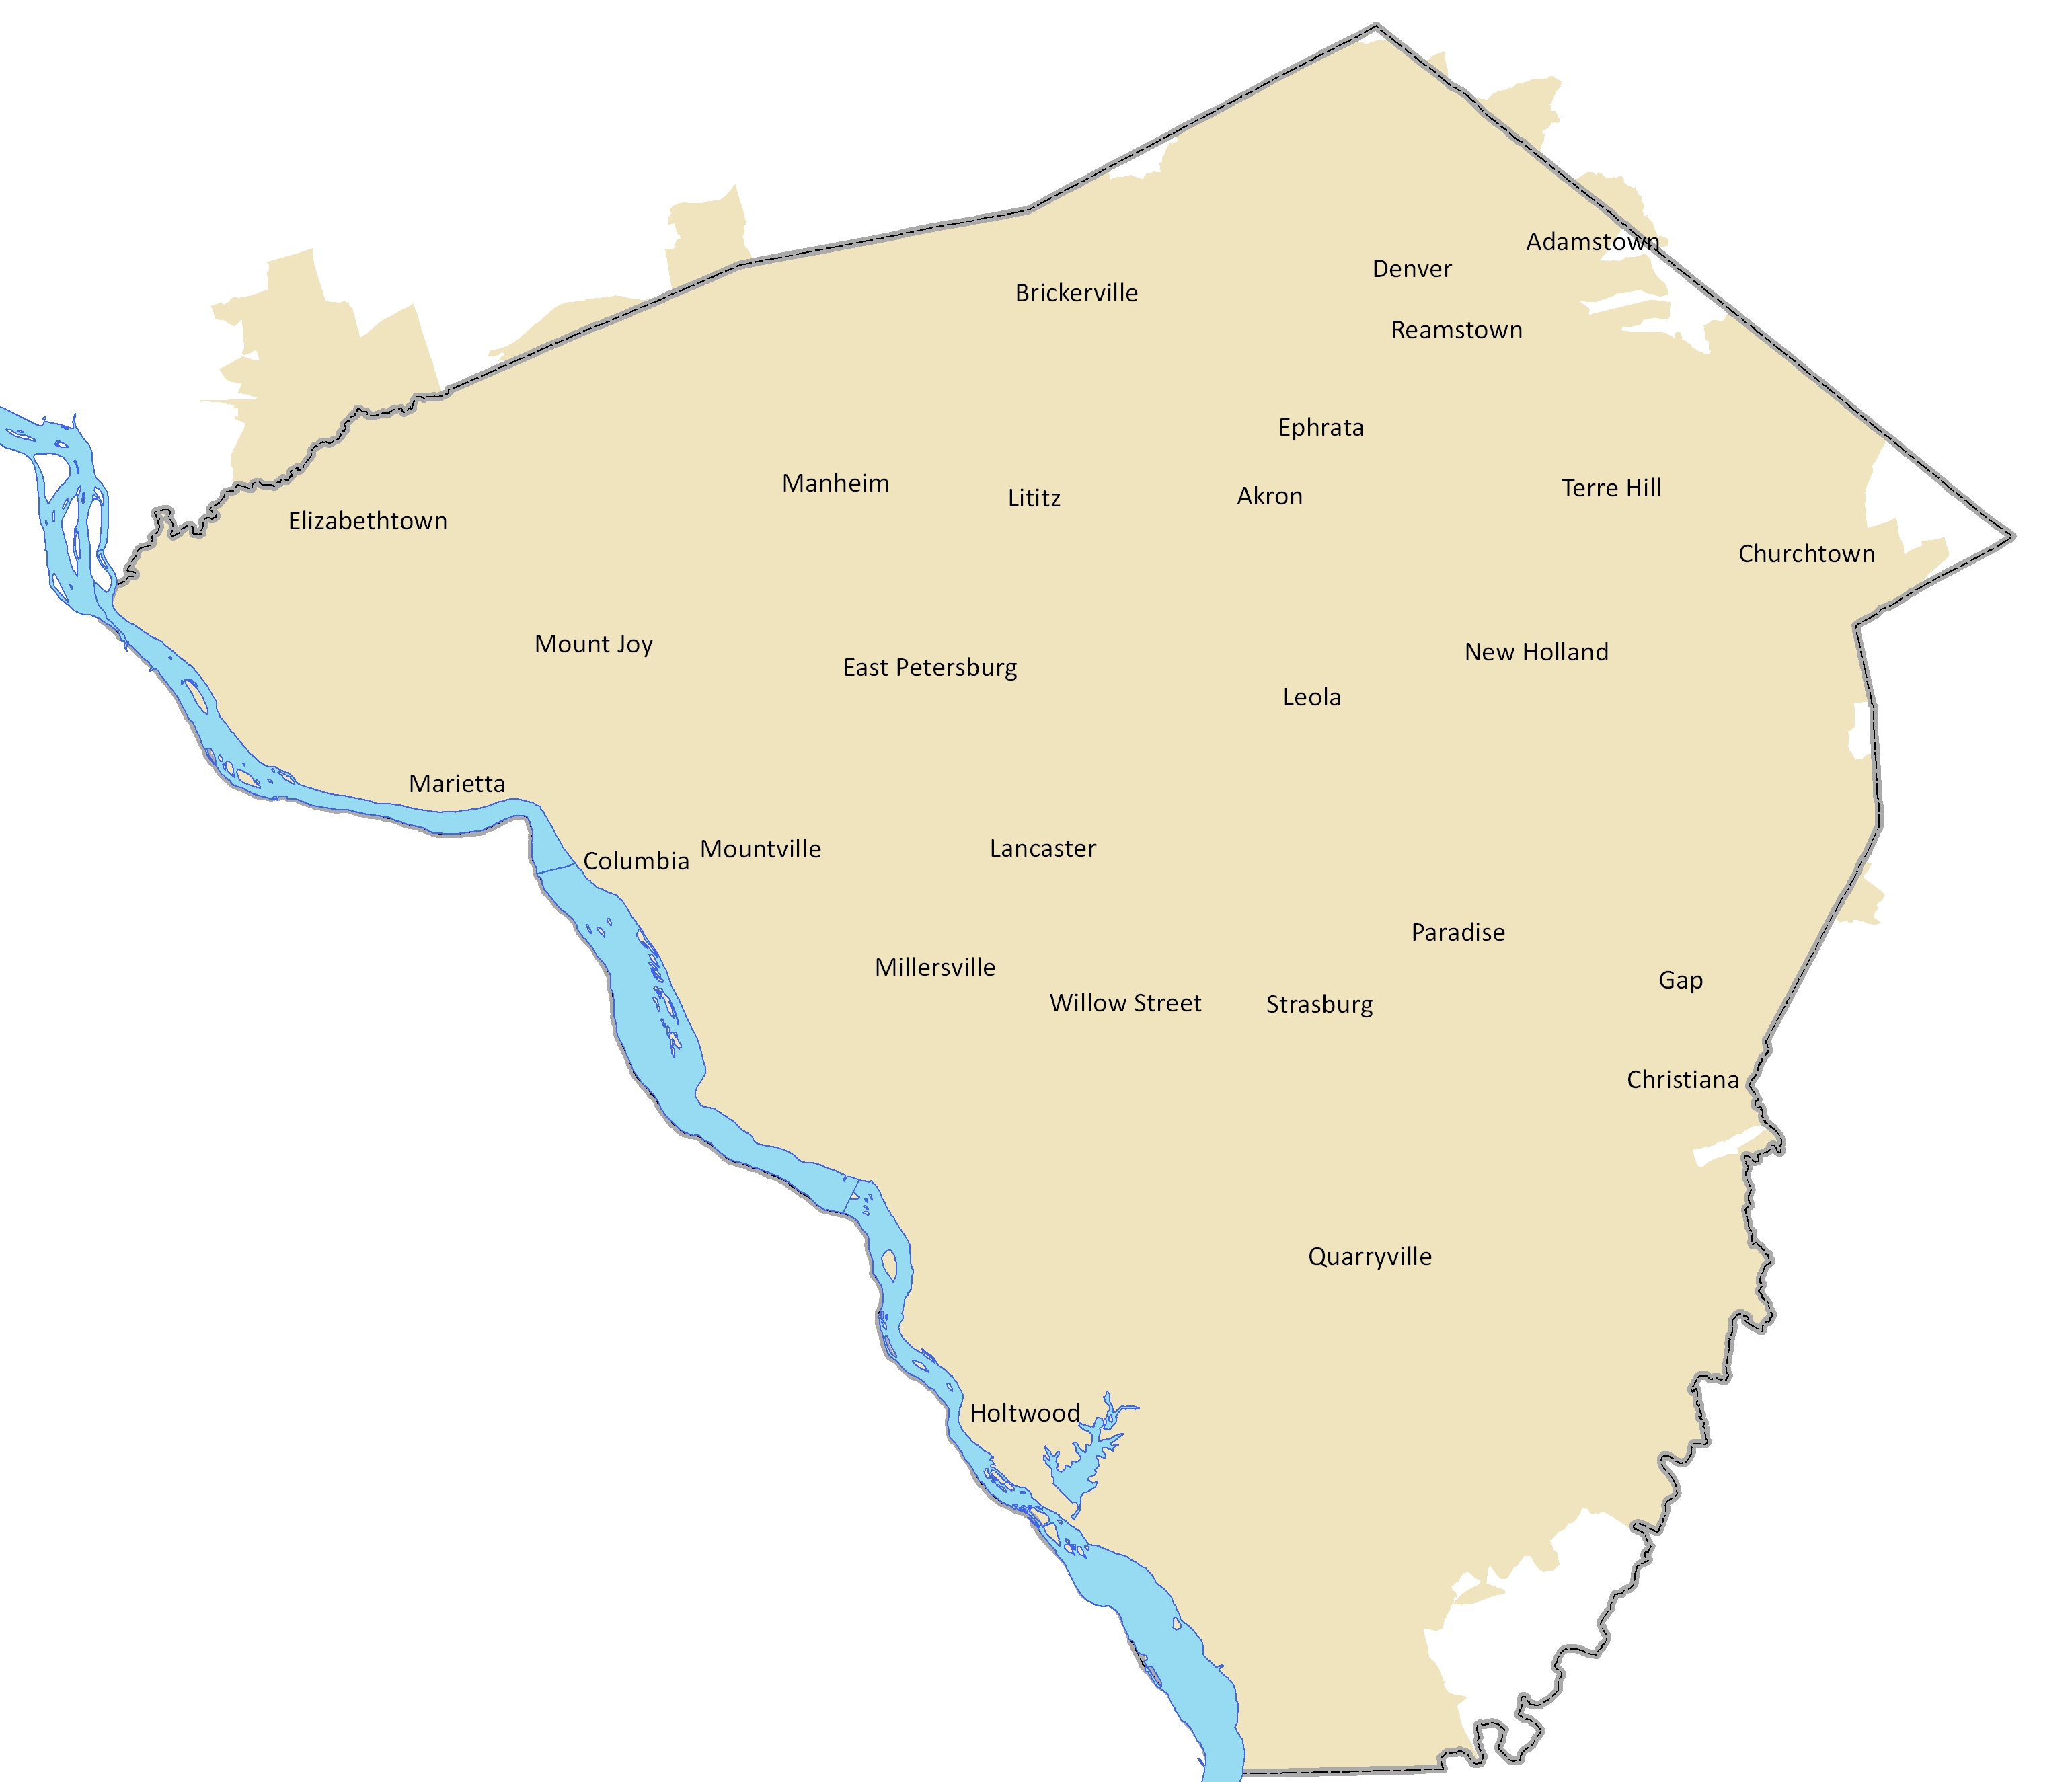
The maps below show the zip areas associated with the urban, rural and northeast regions in Lancaster County. Some zip codes in Lancaster County may not be associated with population or demographics data (e.g., PO Box zip codes). If you do not find your zip code in the drop down menu, look at the data for the zip area in which you reside.
| Urban Zip Areas | Rural Zip Areas | Northeast Zip Areas | All Zip Areas |
 |
 |
 |
 |
Households/Income Data for County: Lancaster
Jump to:
Households
County: Lancaster
209,017
Households
State: Pennsylvania 5,206,299 Households
Percent Household Change: 2020 to 2024
County: Lancaster
1.24%
State: Pennsylvania -0.08%
Families
County: Lancaster
146,185
Families
State: Pennsylvania 3,377,550 Families
Percent Family Change: 2020 to 2024
County: Lancaster
2.18%
State: Pennsylvania 2.00%
| Households by Number of People in Household | County: Lancaster | State: Pennsylvania | ||
|---|---|---|---|---|
| Households | % of Households | Households | % of Households | |
| 1-Person | 49,177 | 23.53% | 1,542,195 | 29.62% |
| 2-Person | 77,010 | 36.84% | 1,777,942 | 34.15% |
| 3-Person | 32,006 | 15.31% | 791,865 | 15.21% |
| 4-Person | 26,462 | 12.66% | 638,737 | 12.27% |
| 5-Person | 12,985 | 6.21% | 281,013 | 5.40% |
| 6-Person | 5,588 | 2.67% | 107,890 | 2.07% |
| 7+ Person | 5,789 | 2.77% | 66,657 | 1.28% |
Average Household Size
County: Lancaster
2.61
Persons
State: Pennsylvania 2.41 Persons
Households With Own Children
County: Lancaster
58,999
Households
(28.23% of Households)
(28.23% of Households)
State: Pennsylvania 1,285,321 Households (24.69% of Households)
| Households by Income | County: Lancaster | State: Pennsylvania | ||
|---|---|---|---|---|
| Households | % of Households | Households | % of Households | |
| Under $15,000 | 13,150 | 6.29% | 459,122 | 8.82% |
| $15,000 - $24,999 | 11,858 | 5.67% | 383,298 | 7.36% |
| $25,000 - $34,999 | 12,710 | 6.08% | 378,590 | 7.27% |
| $35,000 - $49,999 | 22,424 | 10.73% | 571,593 | 10.98% |
| $50,000 - $74,999 | 35,428 | 16.95% | 828,240 | 15.91% |
| $75,000 - $99,999 | 32,176 | 15.39% | 668,945 | 12.85% |
| $100,000 - $124,999 | 24,951 | 11.94% | 527,360 | 10.13% |
| $125,000 - $149,999 | 17,000 | 8.13% | 386,398 | 7.42% |
| $150,000 - $199,999 | 17,365 | 8.31% | 436,507 | 8.38% |
| $200,000 - $249,999 | 8,790 | 4.21% | 216,612 | 4.16% |
| $250,000 - $499,999 | 8,871 | 4.24% | 226,821 | 4.36% |
| $500,000+ | 4,294 | 2.05% | 122,813 | 2.36% |
Average Household Income
County: Lancaster
$106,862
State: Pennsylvania $104,046
Median Household Income
County: Lancaster
$81,945
State: Pennsylvania $74,466
| Average Household Income by Race/Ethnicity | County: Lancaster | State: Pennsylvania |
|---|---|---|
| Value | Value | |
| All | $106,862 | $104,046 |
| White | $100,522 | $98,394 |
| Black/African American | $68,762 | $63,930 |
| American Indian/Alaskan Native | $112,424 | $75,687 |
| Asian | $101,099 | $113,028 |
| Native Hawaiian/Pacific Islander | $57,287 | $77,308 |
| Some Other Race | $71,117 | $65,226 |
| 2+ Races | $90,066 | $87,688 |
| Hispanic/Latino | $68,473 | $66,427 |
| Non-Hispanic/Latino | $110,896 | $106,775 |
| Median Household Income by Race/Ethnicity | County: Lancaster | State: Pennsylvania |
|---|---|---|
| Value | Value | |
| All | $81,945 | $74,466 |
| White | $85,087 | $80,283 |
| Black/African American | $56,729 | $46,899 |
| American Indian/Alaskan Native | $81,750 | $52,513 |
| Asian | $83,870 | $93,904 |
| Native Hawaiian/Pacific Islander | $43,958 | $48,981 |
| Some Other Race | $51,213 | $47,087 |
| 2+ Races | $75,544 | $68,524 |
| Hispanic/Latino | $59,873 | $54,730 |
| Non-Hispanic/Latino | $84,373 | $76,179 |
Families Below Poverty
County: Lancaster
8,479
Families
(5.80% of Families)
(5.80% of Families)
State: Pennsylvania 279,510 Families (8.28% of Families)
Families Below Poverty with Children
County: Lancaster
5,096
Families
(3.49% of Families)
(3.49% of Families)
State: Pennsylvania 198,622 Families (5.88% of Families)
Demographics information provided by Claritas, updated April 2024, under these terms of use.