Indicator Gauge Icon Legend
Legend Colors
Red is bad, green is good, blue is not statistically different/neutral.
Compared to Distribution
 the value is in the best half of communities.
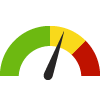 the value is in the 2nd worst quarter of communities.
 the value is in the worst quarter of communities.
Compared to Target
 meets target;
  does not meet target.
Compared to a Single Value
 lower than the comparison value;
 higher than the comparison value;
 not statistically different from comparison value.
Trend

 non-significant change over time;
 significant change over time;
  no change over time.
Compared to Prior Value
 higher than the previous measurement period;
 lower than the previous measurement period;
 no statistically different change from previous measurement period.
 Significantly better than the overall value
 Significantly worse than the overall value
 No significant difference with the overall value
 No data on significance available
Violent Crime Rate
State: Pennsylvania
Measurement Period: 2022
This indicator is archived and is no longer being updated. Click to learn more
This indicator shows the total violent crime rate per 100,000 population.
Violent crimes include murder, rape, robbery, and aggravated assault.
Why is this important?
Violence is an urgent public health problem and negatively impact mental, emotional, physical, and social well-being. Living in a community experiencing violence is also associated with increased risk of developing chronic diseases (Centers for Disease Control and Prevention). Concerns about violence may prevent some people from engaging in healthy behaviors, such as walking, bicycling, using parks, and accessing healthy food (Centers for Disease Control and Prevention).
Considerations for Equitable Approaches: Young people are disproportionately impacted by violence in their communities, including firearm injuries and deaths. Communities of color often disproportionately experience violence. To prevent community violence, it is important to collaborate with different sectors and address the conditions that increase the risk of violence. Street outreach and intervention programs can address immediate risks for violence, while a comprehensive approach addressing societal factors can have the greatest short and long-term impact (Centers for Disease Control and Prevention).
279.4
crimes/ 100,000 population
Source:
Pennsylvania Uniform Crime Reporting System
Measurement period: 2022
Maintained by: Conduent Healthy Communities Institute
Last update: October 2023
Measurement period: 2022
Maintained by: Conduent Healthy Communities Institute
Last update: October 2023
Compared to

Graph Selections

Data Source
- Pennsylvania Uniform Crime Reporting System
Maintained By: Conduent Healthy Communities Institute (Methodology)
Filed under: Community / Crime & Crime Prevention, Social Determinants of Health